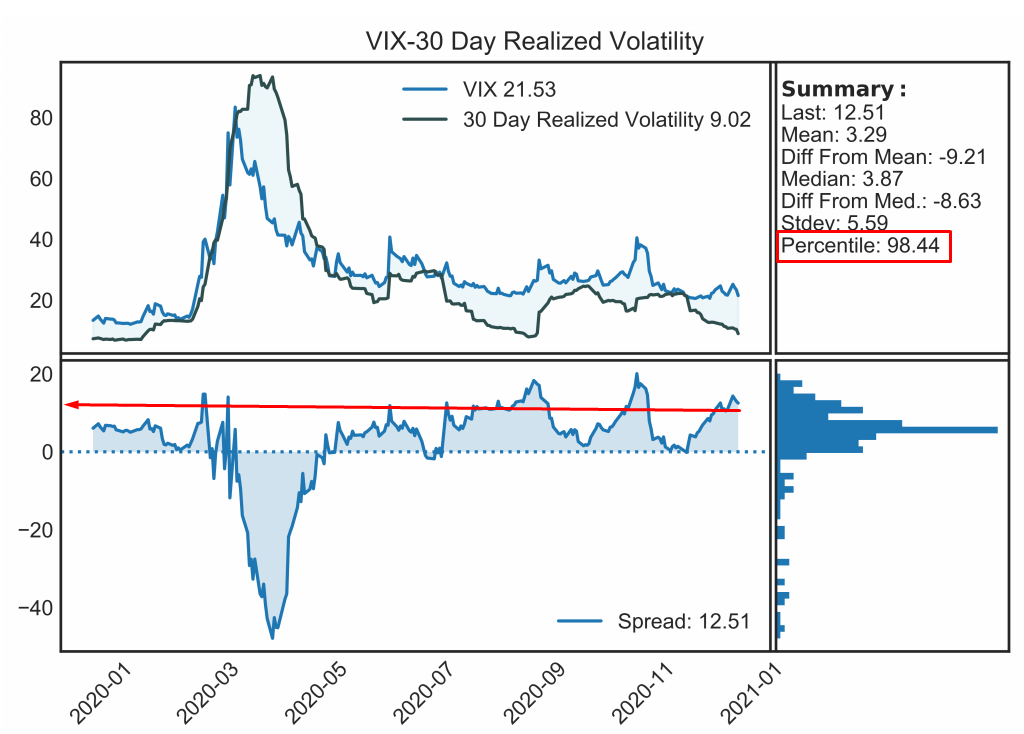
$VIX is calculated at 21.53% as of the close on December 24th. Compared to March where it was calculated near 90%, it is hard to argue that it is high.
In our last post, we attempted to answer the same question. Is $VIX high?
With limited data, we concluded that $VIX was not necessarily high and that it could be higher. Of course, asset volatility cooled down, with the help of Brrr.
In this blog post, we will attempt to to tell the story of the following:
- Is $VIX High?
- What do the similar precedents look like?
- What has it meaned historically on a look-forward basis for the S&P500.
- Are we missing anything?
As of close on Thursday December 24, 2020, the $VIX closed at 21.53. Looking on the histogram we can see that this does not look particularly high (at least compared to the blue line which we saw in March after the bottom).
VIX Histogram

Again, when you compare it to 30 day realized volatility (21 trading days), the picture is vastly different. The metric is ranking in at 98 percentile for the past 10 ish years.
Implied-Realized Volatility Spread

This would appear to be very surprising as in the past week from high to low on the $VIX is nearly 10 points (We are off 10 vols and the pct rank is still 98?!?)
This is 2020 after all, so let’s put it in the context of 2020. The chart below shows percent ranks on various timeframes for the VIX-HRV spread compared to 10 day forward SPY returns.
VIX-Historical Realized Volatility Percentile Against Forward 10 Day SPY Returns

So to answer #1 (Is $VIX High?), The spread is extreme on a long term historical basis, but not extreme for 2020…. oooooof courseee:
3 month, 6 month and 1 year percentiles are all under 90 percent – with the Pct. Rank only surpassing 95% on a 2 year, 5 year and 10 year basis.
To answer #2 (What do the similar precedents look like?), the chart below shows each instance where the spread has been greater than 10 points, since the early 1990’s – there are about 264 datapoints (overlapping).
SPY When VIX-HRV >10 Points

And… to answer #3 (What has it meaned historically on a look-forward basis for the S&P500):
To Summarize, the spread below out often at market bottoms, and less often at market tops. On a forward one month basis the $SPY has returned a mean of 3.2% (Green line, green dots) vs. a mean of .86% (grey dotted line, grey dots) for all data.
Mean 20-day return for SPY

The distribution is skewed to the right (green), compared to all the data (purple).
20-Day Return Distribution

Over the following 60 days, the 5th percentile is a mere -3%, with minimum oopsies occurring around day 16 and day 40 in the -20 range.

And… finally to answer #4, (are we missing anything?)
Harol Jacobson has done a wonderful post below on various ways to measure realized volatility. Of particular importance is his “Variance Ratio” – simply the ratio of a high sampling frequency volatility estimator to a low sampling frequency volatility estimator.
https://medium.com/swlh/the-realized-volatility-puzzle-588a74ab3896
Interestingly, the variance Ratio is currently blowing out (we use Yang Zhang / Close to Close), which is currently sitting at 1.8 (*note the data captures the odd SPY trades from the 21st of December) and has not been as high since 2012. This is used by Harol to indicate a high degree of mean-reversion occurring in the market. ie. Intraday volatility is much higher than close to close volatility.:
SPY Variance Ratio Signals

Over the following 20 trading days the SPY returned an average of -.14% Vs. an anytime average of .86%, though there is not enough data to say it is significant.
SPY Variance Ratio Fwd. Returns

To Summarize, VIX is high, but not 2020 high – trading in the 80-90 percentile range on a 3 month to 1 year lookback. While on a short term basis, we could reasonably expect the spread to increase even further, the bulk of the evidence (that we have looked at) suggests that it would be a dip buying-opportunity.
Thanks for reading this blog post, we hope you had some well deserved time off for the Holidays. If you enjoyed the content, you can support us by following myself on twitter @halferspower, my Partner on Twitter, Tweet_at_DLH and subscribing to receive free email updates (right hand side of site).
You can easily backtest this data on my webapp Tradewell at www.tradewell.app
Thank you,
Robby
