VIX is f***g high right? How high is VIX?
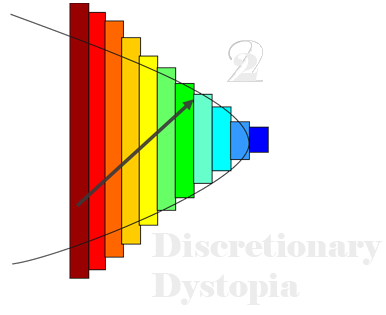
The blue line on the histogram is VIX as of close on March 26, 2020. That looks pretty high… but is it really?
VIX Histogram

Volatility can be high, volatility can be low – however if you are not aware of volatility tendencies you cannot be certain whether volatility is high or low. What does this mean? It means volatility levels are relative, not absolute.
The simplest measure to reflect the relative price of volatility is by comparing historical volatility to implied volatility. The implied volatility index VIX, looks at a constant maturity 30 day Implied Volatility given SPX options. So, our most comparable, most generic Historical Volatility metric would be a simple 30 day standard deviation of SPX returns.
Here is what that chart looks like as of close today:
VIX-30 Day Realized Volatility (Volatility GAP)

So what does this chart show?
1. 30 (actual) day realized volatility is 93.7%
2. Implied volatility is 61.0%
3. The spread between implied volatility and 30 (actual) day realized volatility is -32.72 points.
4. This ranks at .15 percentile on data going back to around 2004, indicating that this spread has only been more negative on .15% of trading days during this time period.
So. Is implied volatility cheap or expensive? Implied Volatility is undoubtedly high – if you take a percentile on absolute implied volatilities this would likely rank in the 1% range. However relative to Historical Realized Volatility, Implied Volatility is insanely cheap. Volatility is expensive, and cheap at the same time, but one of the metrics has much more information than the other.
You may be wondering, well when was the implied – realized spread wider? The answer of course, is 2008. Based on the data we track, between October and December 2008 is the best parallel to the current market. The chart below shows the price action of the S&P500 in 2008 compared to the spread between Implied Volatility and Historical Realized Volatility.
Volatility GAP 2008

Our Best guess is that we are currently falling somewhere between October 29th and October 31st in 2008 equivalent (where we also saw this spread blow out 30 points). This has nothing to do with price itself – and everything to do with the disconnect between Implied Volatility and Historical Realized Volatility. In 2008 you saw the same pattern you are seeing now – a wide disconnect between the prior month of Historical Realized Volatility and the Implied Volatility for the subsequent month. This meant (of course) in late 2008, market participants were widely ignoring risk. The SPY peaked out at an implied-realized volatility of -45 points, subsequently falling from $100 to under $80 in under two weeks.
This tells us risk is being massively under-priced, and tells us to prepare for more volatility ahead.
We hope you found this post useful, please reach out with any questions.
Riskdials tracks this relationship daily (and much more) in the Private Lunch research report.
Thanks!
If you enjoyed this post, follow us on twitter @discdystopia and subscribe for email updates (top right).
One Comment
Comments are closed.